

Why Your Database Migration Won’t Fix Your Reporting
The migration went well. The new database is faster, more reliable, properly supported. The application performs better. Everyone is pleased.
Then the first month-end arrives, and finance can’t produce the board pack.
This is the moment a particular kind of conversation tends to start. The migration was meant to fix things. Why are reports harder to produce now, not easier? Why is half the team still logging into the old system to pull numbers?
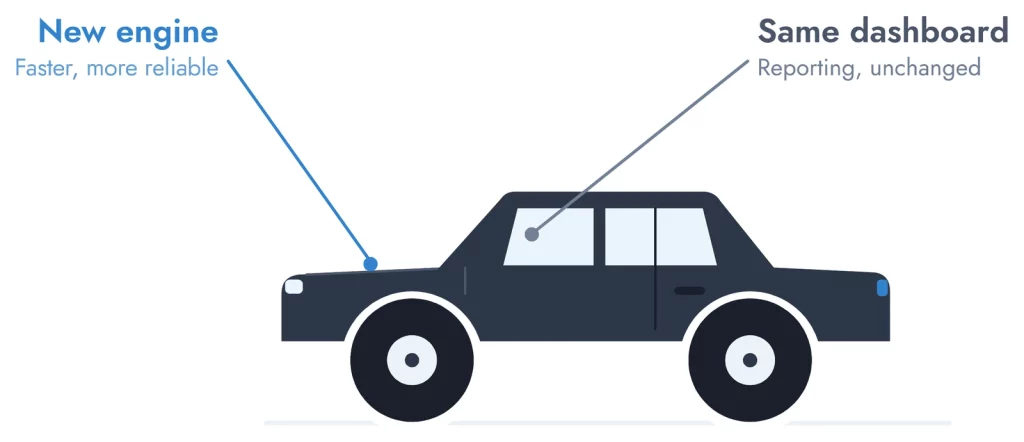
The honest answer rarely makes it into the migration scope: a database migration replaces the engine. It does not move the dashboard. The car drives the same; the instruments never came with it.
Here is why that happens, how to spot it before it bites, and what to do about it.
Two systems, two different jobs
Every organisation of any size runs on two kinds of data system, whether or not they are described that way.
The first is the operational system — the database behind the application that handles the business day to day. Its job is to answer one question: what is true right now, so the application keeps working? It is built for fast writes, concurrent transactions, and absolute reliability. Members joining, jobs being completed, invoices raised — all of it happens here, often thousands of times an hour.
The second is the analytics layer. Its job is to answer different questions: what happened, what is changing, and what should we do about it? It is built for querying history, joining data across systems, and producing numbers the business can stand behind.
Take a familiar pairing. A system like MySQL or Postgres — or, increasingly, a distributed database like CockroachDB — sits behind the application. It stores data in rows, so it can pull back a single customer’s record, or write a single transaction, in milliseconds. The analytics layer stores data differently — in columns — so it can read one field across millions of records and total three years of revenue in seconds. Ask MySQL to do that job and it grinds. Ask an analytics platform to run your application and it falls over. Same data, opposite designs, different jobs.
The analytics layer itself comes in several forms. Google BigQuery suits organisations already in the Google ecosystem that want a fully managed, serverless warehouse — it is what I used with Paddle UK. Microsoft Fabric and Azure Synapse serve the same purpose for Microsoft-aligned businesses, and are a common choice for UK mid-market organisations already running on Azure or Office 365. Snowflake is widely used in data-mature businesses that want a platform-neutral warehouse with strong performance on large workloads. Databricks suits organisations with engineering-heavy teams or real-time requirements. The right choice depends on the existing estate, the team, and the reporting volumes involved. The architecture pattern is the same across all of them.
That is the heart of it. The design choices that make an operational database fast and reliable are exactly the choices that make it bad for reporting. And the design choices that make an analytics layer effective would cripple an operational system if applied to it.
The confusion persists because a migration is scoped and sold as a database project. The reporting question — the one the migration itself won’t answer — never gets asked, because nobody draws the distinction clearly enough for it to surface.
The hidden-dependency trap
What actually bites is usually not the absence of reporting. It is the hidden presence of reporting that was quietly running off the old database all along.
Direct queries written years ago by someone who has since left. A read replica spun up to take pressure off the live system. An old data mart that nobody quite remembers commissioning. Hand-built extracts that finance runs at the start of every month.
Decommission the old system and you decommission the thing half the reports were secretly depending on.
The symptom is recognisable: “we can’t switch off the old system because finance still runs month-end off it.” That sentence, more or less verbatim, is one of the most common reasons migration cutover dates slip.
What makes this worse than a simple gap is the timing. It is not noticed in calm planning. It is discovered at cutover, when there is no longer room to fix it properly — only to patch it.
Three questions to surface the gap before it bites
If a migration is in your roadmap — or in flight — three questions are worth asking now, before the cutover conversation forces them.
- When you switch the old system off, where does the board pack come from the next morning? If the answer is hesitation, or “we’ll work that out closer to the time,” that is the finding.
- If someone asks a question that spans two systems over three years, who answers it and how long does it take? If the honest answer involves a spreadsheet, a long evening, and a degree of negotiation, the analytics layer is not where it needs to be.
- Is your reporting running off the same database as your application, or a separate one? If you are not sure, that is the finding.
Hesitation on question one. A long manual process on question two. “The same, I think” on question three. All three point to the same underlying gap.
What good looks like
The principle is straightforward, even when the work is not. Reporting does not belong bolted onto the operational system. It belongs in a separate analytics layer that takes a clean feed from the operational systems, joins them, and produces one trusted version of the numbers.
The shape is platform-neutral. A modern setup will usually involve a warehouse (BigQuery, Fabric, Snowflake, Databricks — the choice depends on the wider estate), a modelled transformation layer that turns raw operational data into business-meaningful tables, and a reporting tool that sits on top. The pattern matters more than the brand on any single component.
The part most often missed is that the hard work is not the pipeline. It is deciding what the numbers should mean. Definitions, ownership, the business logic of how a “member” is counted or a “job” is closed. Technology moves the data. Judgement decides what is worth measuring, and who owns the answer.
This is also the work that protects a migration. If the analytics layer is properly defined and properly built, the operational system underneath it can be replaced, upgraded, or migrated without finance noticing.
A short proof point: Paddle UK
Paddle UK, the national governing body for paddlesport, had data spread across operational systems for membership, race results, and qualifications. The systems worked. The aggregation did not — figures were assembled manually, fragmentary, and slow to produce.
We built a separate analytics layer alongside the operational systems: a BigQuery warehouse, a modelled transformation layer, Power BI for the front end. The operational systems were not replaced. They were not even changed.
The outcome was the first reliable, daily-updated view of membership the organisation had ever had. The manual aggregation was retired. Decisions started being made on trusted numbers rather than on the best version anyone could pull together by Thursday.
The lesson that ties this back to the article: the systems Paddle UK already ran were never the problem. What was missing was the layer those operational systems were never designed to provide.
Full case study: Paddle UK — building a trusted view of membership data.
If a migration is on your roadmap
The takeaway is short. If a migration is being planned, scoped, or in flight, the reporting question is not a phase-two detail. It is the part most likely to go wrong at the worst possible moment, and the part the migration itself will not solve for you.
If you would find it useful to pressure-test where your reporting actually comes from before the cutover conversation forces the question, book a discovery call.
Responsive Analytix works alongside migration projects, not instead of them — as the specialist on the analytics layer that needs to exist beside the operational one.
Find out about our date platform build.